
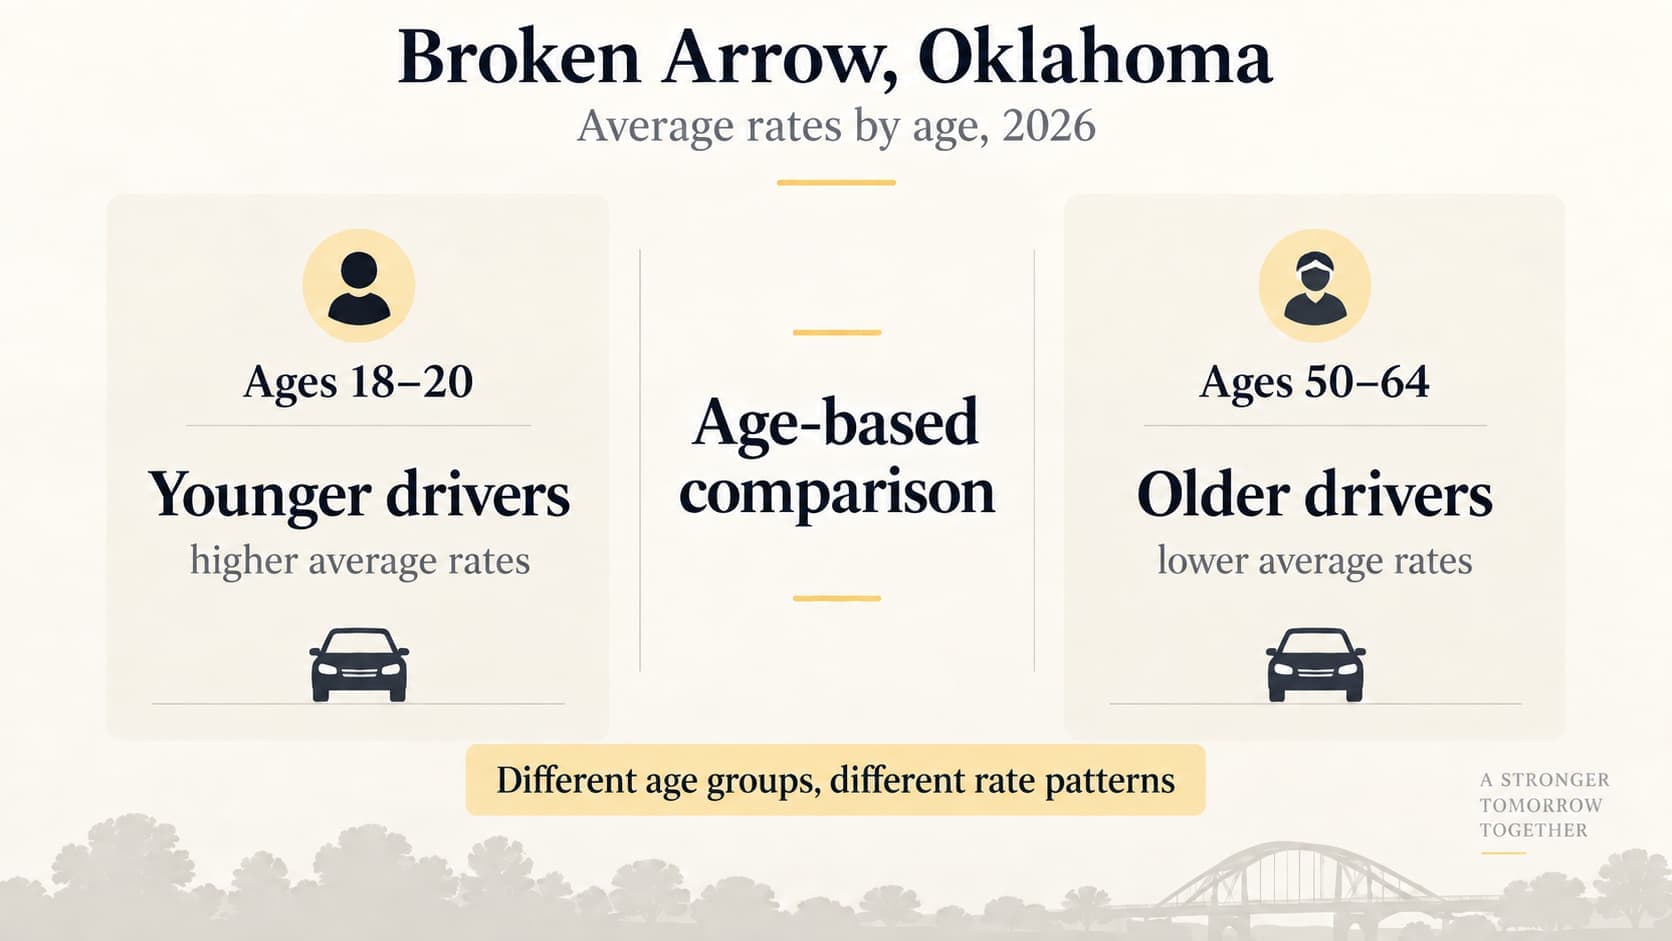
The average liability rate for drivers ages 18–20 is 130% higher than it is for drivers ages 50–64, according to 2026 Broken Arrow rate data.
Age makes the biggest difference at the younger end of the car insurance market in Broken Arrow.
Liability averages $115 a month for drivers ages 18–20. By ages 21–24, it falls to $71. By ages 25–29, the average is $60.
After that, the numbers barely move.
From age 30 through 64, average liability stays between $50 and $56 a month. Full coverage follows a similar pattern early on, dropping from $187 among ages 18–20 to $92 among ages 25–29.
The sharpest differences, in other words, show up well before middle age.
Key Findings
- Ages 18–20 have the highest average rates: $115 a month for liability and $187 for full coverage.
- Liability is nearly 48% lower by ages 25–29, falling from $115 to $60 a month.
- Full coverage is about 51% lower by ages 25–29, dropping from $187 to $92.
- The average liability rate for ages 18–20 is 130% higher than the $50 average for ages 50–64.
- Liability changes by only $6 a month between ages 30 and 64.
- Full coverage reaches its lowest average earlier than liability, at $83 a month between ages 30 and 39.
- The difference between the highest and lowest averages works out to about $780 a year for liability and $1,248 a year for full coverage.
Broken Arrow Car Insurance Rates by Age
| Age | Liability | Full Coverage |
| 18–20 | $115 | $187 |
| 21–24 | $71 | $122 |
| 25–29 | $60 | $92 |
| 30–34 | $56 | $83 |
| 35–39 | $56 | $83 |
| 40–44 | $56 | $84 |
| 45–49 | $54 | $84 |
| 50–54 | $50 | $85 |
| 55–59 | $50 | $86 |
| 60–64 | $50 | $88 |
| 65–69 | $51 | $90 |
| 70–75 | $51 | $90 |
Chart: Broken Arrow Car Insurance Rates by Age, 2026
Average monthly liability and full coverage rates by age group.
Younger Drivers See the Biggest Difference
The first few age groups account for most of the change.
Liability falls from $115 a month at ages 18–20 to $71 at ages 21–24. That is a $44 monthly difference, or about 38%.
Full coverage falls from $187 to $122 over the same age groups, a drop of about 35%.
The numbers continue moving lower through the late 20s, but not by as much. Liability averages $60 at ages 25–29, while full coverage averages $92.
Compared with ages 18–20, that is $55 less a month for liability and $95 less for full coverage.
Over a year, the difference comes to $660 for liability and $1,140 for full coverage.
The numbers also put the familiar idea of insurance “dropping at 25” into perspective. The biggest change in Broken Arrow happens earlier, between the first two age groups. Rates continue to fall through the 20s, but the gaps get smaller along the way.
By ages 30–34, liability is down to $56 and full coverage to $83.
After 30, the Numbers Change Much Less
The rate pattern looks very different once drivers reach their 30s.
Liability averages $56 a month at ages 30–34, 35–39 and 40–44. It then moves to $54 at ages 45–49 and $50 from ages 50 through 64.
That is only a $6 spread across more than three decades of age groups.
Full coverage is similarly steady. It averages $83 at ages 30–39, $84 at ages 40–49, and then gradually moves up to $88 by ages 60–64.
So while age is associated with large price differences among younger drivers, the differences become much smaller later on.
That is useful context for anyone comparing rates by age. A five- or ten-year difference in age does not necessarily mean the same thing at 20 that it does at 40 or 50.
Liability and Full Coverage Reach Their Lowest Averages at Different Ages
Liability is cheapest between ages 50 and 64, when the average is $50 a month.
Compared with the $115 average among ages 18–20, that is $65 less each month, or about $780 a year.
The younger group’s average is 130% higher.
Full coverage looks a little different.
Its lowest average appears much earlier, at $83 a month between ages 30 and 39.
That is $104 less a month than the $187 average among ages 18–20, a difference of about $1,248 a year.
After age 40, full coverage begins moving back up, but only gradually. It reaches $90 a month by ages 65–75.
That is just $7 above its lowest point.
The two coverage types therefore do not follow exactly the same path. Liability continues getting slightly cheaper well into middle age, while full coverage bottoms out earlier and then slowly increases.
Younger-Driver Rates Fit a Broader Risk Pattern
The larger difference among younger drivers is not unique to insurance pricing.
In Oklahoma, teen drivers have the highest crash rate of any age group. Inexperience, distractions, nighttime driving and speeding are among the factors associated with higher risk among younger drivers.
Nationally, fatal crash rates per mile driven among 16–19-year-olds are about three times the rate among drivers age 20 and older. Police-reported crash rates of all severities are even higher among teenagers.
Those crash statistics do not explain any one Broken Arrow premium, but they help put the age differences into context.
Insurance companies also look at much more than age.
Other factors that can affect an Oklahoma auto insurance premium include driving and claims history, where the vehicle is kept, vehicle type and value, coverage limits, deductibles and annual mileage.
That is why two drivers in the same age group can still end up with very different prices.
Oklahoma’s 2026 auto insurance rate comparison shows the same thing from another angle. Standardized driver profiles at ages 16, 21, 36, 55 and 70 still receive different prices across insurance companies.
Age matters, but it is only one part of the rate.
What the Broken Arrow Numbers Show
The clearest difference is between the youngest drivers and everyone who comes after them.
Liability drops from $115 a month at ages 18–20 to $56 by ages 30–34. Full coverage falls from $187 to $83.
After that, the changes are relatively small.
Liability stays between $50 and $56 through age 75. Full coverage stays between $83 and $90.
For Broken Arrow drivers, most of the age-related difference in these numbers happens early.
About the Data
Cheapest Auto Insurance analyzed 2026 Broken Arrow rate data from Save Money Car Insurance across 12 age groups, from ages 18–20 through 70–75. The analysis includes average monthly liability and full coverage rates, along with calculated percentage and annual cost differences.
Rates are averages and may differ from an individual quote based on the driver, vehicle, coverage and other rating factors.